Notebook: using jsonstat.py python library with jsonstat format version 1.
This Jupyter notebook shows the python library jsonstat.py in action. The JSON-stat is a simple lightweight JSON dissemination format. For more information about the format see the official site. This example shows how to explore the example data file oecd-canada from json-stat.org site. This file is compliant to the version 1 of jsonstat.
# all import here
from __future__ import print_function
import os
import pandas as ps # using panda to convert jsonstat dataset to pandas dataframe
import jsonstat     # import jsonstat.py package

import matplotlib as plt  # for plotting
%matplotlib inline
Download or use cached file oecd-canada.json. Caching file on disk permits to work off-line and to speed up the exploration of the data.
url = 'http://json-stat.org/samples/oecd-canada.json'
file_name = "oecd-canada.json"

file_path = os.path.abspath(os.path.join("..", "tests", "fixtures", "www.json-stat.org", file_name))
if os.path.exists(file_path):
    print("using already downloaded file {}".format(file_path))
else:
    print("download file and storing on disk")
    jsonstat.download(url, file_name)
    file_path = file_name
using already downloaded file /Users/26fe_nas/gioprj.on_mac/prj.python/jsonstat.py/tests/fixtures/www.json-stat.org/oecd-canada.json
Initialize JsonStatCollection from the file and print the list of dataset contained into the collection.
collection = jsonstat.from_file(file_path)
collection
| pos | dataset |
| 0 | 'oecd' |
| 1 | 'canada' |
Select the dataset named oedc. Oecd dataset has three dimensions
(concept, area, year), and contains 432 values.
oecd = collection.dataset('oecd')
oecd
| pos | id | label | size | role |
| 0 | concept | indicator | 1 | metric |
| 1 | area | OECD countries, EU15 and total | 36 | geo |
| 2 | year | 2003-2014 | 12 | time |
Shows some detailed info about dimensions
oecd.dimension('concept')
| pos | idx | label |
| 0 | 'UNR' | 'unemployment rate' |
oecd.dimension('area')
| pos | idx | label |
| 0 | 'AU' | 'Australia' |
| 1 | 'AT' | 'Austria' |
| 2 | 'BE' | 'Belgium' |
| 3 | 'CA' | 'Canada' | ... | ... | ... |
oecd.dimension('year')
| pos | idx | label |
| 0 | '2003' | '' |
| 1 | '2004' | '' |
| 2 | '2005' | '' |
| 3 | '2006' | '' | ... | ... | ... |
Accessing value in the dataset
Print the value in oecd dataset for area = IT and year = 2012
oecd.data(area='IT', year='2012')
JsonStatValue(idx=201, value=10.55546863, status=None)
oecd.value(area='IT', year='2012')
10.55546863
oecd.value(concept='unemployment rate',area='Australia',year='2004') # 5.39663128
5.39663128
oecd.value(concept='UNR',area='AU',year='2004')
5.39663128
Trasforming dataset into pandas DataFrame
df_oecd = oecd.to_data_frame('year', content='id')
df_oecd.head()
| concept | area | Value | |
|---|---|---|---|
| year | |||
| 2003 | UNR | AU | 5.943826 |
| 2004 | UNR | AU | 5.396631 |
| 2005 | UNR | AU | 5.044791 |
| 2006 | UNR | AU | 4.789363 |
| 2007 | UNR | AU | 4.379649 |
df_oecd['area'].describe() # area contains 36 values
count     432
unique     36
top        JP
freq       12
Name: area, dtype: object
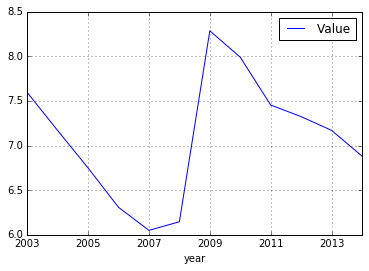
Extract a subset of data in a pandas dataframe from the jsonstat dataset. We can trasform dataset freezing the dimension area to a specific country (Canada)
df_oecd_ca = oecd.to_data_frame('year', content='id', blocked_dims={'area':'CA'})
df_oecd_ca.tail()
| concept | area | Value | |
|---|---|---|---|
| year | |||
| 2010 | UNR | CA | 7.988900 |
| 2011 | UNR | CA | 7.453610 |
| 2012 | UNR | CA | 7.323584 |
| 2013 | UNR | CA | 7.169742 |
| 2014 | UNR | CA | 6.881227 |
df_oecd_ca['area'].describe() # area contains only one value (CA)
count     12
unique     1
top       CA
freq      12
Name: area, dtype: object
df_oecd_ca.plot(grid=True)
<matplotlib.axes._subplots.AxesSubplot at 0x113980908>
Trasforming a dataset into a python list
oecd.to_table()[:5]
[['indicator', 'OECD countries, EU15 and total', '2003-2014', 'Value'],
 ['unemployment rate', 'Australia', '2003', 5.943826289],
 ['unemployment rate', 'Australia', '2004', 5.39663128],
 ['unemployment rate', 'Australia', '2005', 5.044790587],
 ['unemployment rate', 'Australia', '2006', 4.789362794]]
It is possible to trasform jsonstat data into table in different order
order = [i.did() for i in oecd.dimensions()]
order = order[::-1]  # reverse list
table = oecd.to_table(order=order)
table[:5]
[['indicator', 'OECD countries, EU15 and total', '2003-2014', 'Value'],
 ['unemployment rate', 'Australia', '2003', 5.943826289],
 ['unemployment rate', 'Austria', '2003', 4.278559338],
 ['unemployment rate', 'Belgium', '2003', 8.158333333],
 ['unemployment rate', 'Canada', '2003', 7.594616751]]