We starts importing some modules.
Step 1: using istat module to get a jsonstat collection
Following code sets a cache dir where to store json files download by
Istat api. Storing file on disk speed up development, and assures
consistent results over time. Anyway you can delete file to donwload a
fresh copy.
cache_dir = os.path.abspath(os.path.join("..", "tmp", "istat_cached"))
istat.cache_dir(cache_dir)
print("cache_dir is '{}'".format(istat.cache_dir()))
cache_dir is '/Users/26fe_nas/gioprj.on_mac/prj.python/jsonstat.py/tmp/istat_cached'
Using istat api, we can shows the istat areas used to categorize the
datasets
| id | desc |
|---|
| 3 | 2011 Population and housing census |
| 4 | Enterprises |
| 7 | Environment and Energy |
| 8 | Population and Households |
| 9 | Households Economic Conditions and Disparities |
| 10 | Health statistics |
| 11 | Social Security and Welfare |
| 12 | Education and training |
| 13 | Communication, culture and leisure |
| 14 | Justice and Security |
| 15 | Citizens' opinions and satisfaction with life |
| 16 | Social participation |
| 17 | National Accounts |
| 19 | Agriculture |
| 20 | Industry and Construction |
| 21 | Services |
| 22 | Public Administrations and Private Institutions |
| 24 | External Trade and Internationalisation |
| 25 | Prices |
| 26 | Labour |
Following code list all datasets contained into area Prices.
istat_area_prices = istat.area('Prices')
istat_area_prices.datasets()
| cod | name | dim |
|---|
| DCSC_FABBRESID_1 | Construction costs index - monthly data | 5 |
| DCSC_PREZPRODSERV_1 | Services producer prices index | 5 |
| DCSC_PREZZPIND_1 | Producer price index for industrial products - monthly data | 6 |
| DCSP_FOI1 | FOI Monthly data until 2010 | 5 |
| DCSP_FOI1B2010 | FOI - Monthly data from 2011 to 2015 | 5 |
| DCSP_FOI1B2015 | FOI - Monthly data from 2016 onwards | 5 |
| DCSP_FOI2 | FOI Annual average until 2010 | 5 |
| DCSP_FOI2B2010 | FOI Annual average from 2011 onwards | 5 |
| DCSP_FOI2B2015 | FOI - Annual average from 2016 onwards | 5 |
| DCSP_FOI3 | FOI Weights until 2010 | 4 |
| DCSP_FOI3B2010 | FOI - Weights from 2011 to 2015 | 4 |
| DCSP_FOI3B2015 | FOI - Weights from 2016 onwards | 4 |
| DCSP_IPAB | House price index | 5 |
| DCSP_IPCA1 | HICP - Monthly data from 2001 to 2015 (base 2005=100) | 5 |
| DCSP_IPCA1B2015 | HICP - Monthly data from 2001 onwards (base 2015=100) | 5 |
| DCSP_IPCA2 | HICP - Annual average from 2001 to 2015 (base 2005=100) | 5 |
| DCSP_IPCA2B2015 | HICP - Annual average from 2001 onwards (base 2015=100) | 5 |
| DCSP_IPCA3 | HICP Weights from 2001 onwards | 4 |
| DCSP_IPCATC1 | HICP at constant tax rates - Monthly data from 2002 to 2015 (base 2005=100) | 5 |
| DCSP_IPCATC1B2015 | HICP at constant tax rates - Monthly data from 2002 onwards (base 2015=100) | 5 |
| DCSP_IPCATC2 | HICP at constant tax rates - Annual average from 2002 to 2015 (base 2005=100) | 5 |
| DCSP_IPCATC2B2015 | HICP at constant tax rates - Annual average from 2002 onwards (base 2015=100) | 5 |
| DCSP_NIC1B2015 | NIC - Monthly data from 2016 onwards | 5 |
| DCSP_NIC3B2015 | NIC - Weights from 2016 onwards | 4 |
| DCSP_NICDUE | NIC Annual average until 2010 | 5 |
| DCSP_NICDUEB2010 | NIC Annual average from 2011 onwards | 5 |
| DCSP_NICTRE | NIC Weights until 2010 | 4 |
| DCSP_NICTREB2010 | NIC - Weights from 2011 to 2015 | 4 |
| DCSP_NICUNOB | NIC Monthly data until 2010 | 5 |
| DCSP_NICUNOBB2010 | NIC - Monthly data from 2011 to 2015 | 5 |
List all dimension for dataset DCSP_IPAB (House price index)
istat_dataset_dcsp_ipab = istat_area_prices.dataset('DCSP_IPAB')
istat_dataset_dcsp_ipab
DCSP_IPAB(5):House price index
| nr | name | nr. values | values (first 3 values) |
|---|
| 0 | Territory | 1 | 1:'Italy' |
| 1 | Index type | 3 | 18:'house price index (base 2010=100) - quarterly data', 19:'house price index (base 2010=100) - annual average', 20:'house price index (base 2010=100) - weights' ... |
| 2 | Measure | 5 | 8:'annual average rate of change', 4:'index number', 22:'not applicable' ... |
| 3 | Purchases of dwellings | 3 | 4:'H1 - all items', 5:'H11 - new dwellings', 6:'H12 - existing dwellings' ... |
| 4 | Time and frequency | 29 | 2112:'Q1-2011', 2178:'Q3-2014', 2116:'Q2-2011' ... |
Finally from istat dataset we extracts data in jsonstat format by
specifying dimensions we are interested.
spec = {
    "Territory": 1, "Index type": 18,
    # "Measure": 0, # "Purchases of dwelling": 0, # "Time and frequency": 0
}
# convert istat dataset into jsonstat collection and print some info
collection = istat_dataset_dcsp_ipab.getvalues(spec)
collection
JsonstatCollection contains the following JsonStatDataSet:
| pos | dataset |
| 0 | 'IDMISURA1*IDTYPPURCH*IDTIME' |
The previous call is equivalent to call istat api with a “1,18,0,0,0”
string of number. Below is the mapping from the number and dimensions:
| dimension |
|
|
|---|
| Territory |
1 |
Italy |
| Type |
18 |
house price index (base 2010=100) - quarterly data’ |
| Measure |
0 |
ALL |
| Purchase of dwelling |
0 |
ALL |
| Time and frequency |
0 |
ALL |
json_stat_data = istat_dataset_dcsp_ipab.getvalues("1,18,0,0,0")
json_stat_data
JsonstatCollection contains the following JsonStatDataSet:
| pos | dataset |
| 0 | 'IDMISURA1*IDTYPPURCH*IDTIME' |
step2: using jsonstat.py api.
Now we have a jsonstat collection, let expore it with the api of
jsonstat.py
Print some info of one dataset contained into the above jsonstat
collection
jsonstat_dataset = collection.dataset('IDMISURA1*IDTYPPURCH*IDTIME')
jsonstat_dataset
name: 'IDMISURA1*IDTYPPURCH*IDTIME'label: 'House price index by Measure, Purchases of dwellings and Time and frequency - Italy - house price index (base 2010=100) - quarterly data'size: 207
| pos | id | label | size | role |
| 0 | IDMISURA1 | Measure | 3 | |
| 1 | IDTYPPURCH | Purchases of dwellings | 3 | |
| 2 | IDTIME | Time and frequency | 23 | |
Print info about the dimensions to get an idea about the data
jsonstat_dataset.dimension('IDMISURA1')
| pos | idx | label |
| 0 | '4' | 'index number' |
| 1 | '6' | 'percentage changes on the previous period' |
| 2 | '7' | 'percentage changes on the same period of the previous year' |
jsonstat_dataset.dimension('IDTYPPURCH')
| pos | idx | label |
| 0 | '4' | 'H1 - all items' |
| 1 | '5' | 'H11 - new dwellings' |
| 2 | '6' | 'H12 - existing dwellings' |
jsonstat_dataset.dimension('IDTIME')
| pos | idx | label |
| 0 | '2093' | 'Q1-2010' |
| 1 | '2097' | 'Q2-2010' |
| 2 | '2102' | 'Q3-2010' |
| 3 | '2106' | 'Q4-2010' |
... | ... | ... |
import pandas as pd
df = jsonstat_dataset.to_table(rtype=pd.DataFrame)
df.head()
|
Measure |
Purchases of dwellings |
Time and frequency |
Value |
| 0 |
index number |
H1 - all items |
Q1-2010 |
99.5 |
| 1 |
index number |
H1 - all items |
Q2-2010 |
100.0 |
| 2 |
index number |
H1 - all items |
Q3-2010 |
100.3 |
| 3 |
index number |
H1 - all items |
Q4-2010 |
100.2 |
| 4 |
index number |
H1 - all items |
Q1-2011 |
100.1 |
filtered = df.loc[
    (df['Measure'] == 'index number') & (df['Purchases of dwellings'] == 'H1 - all items'),
    ['Time and frequency', 'Value']
]
filtered.set_index('Time and frequency')
|
Value |
| Time and frequency |
|
| Q1-2010 |
99.5 |
| Q2-2010 |
100.0 |
| Q3-2010 |
100.3 |
| Q4-2010 |
100.2 |
| Q1-2011 |
100.1 |
| Q2-2011 |
101.2 |
| Q3-2011 |
101.2 |
| Q4-2011 |
100.5 |
| Q1-2012 |
99.9 |
| Q2-2012 |
99.1 |
| Q3-2012 |
97.4 |
| Q4-2012 |
95.3 |
| Q1-2013 |
93.9 |
| Q2-2013 |
93.3 |
| Q3-2013 |
91.9 |
| Q4-2013 |
90.2 |
| Q1-2014 |
89.3 |
| Q2-2014 |
88.7 |
| Q3-2014 |
88.3 |
| Q4-2014 |
86.9 |
| Q1-2015 |
86.1 |
| Q2-2015 |
86.1 |
| Q3-2015 |
86.3 |
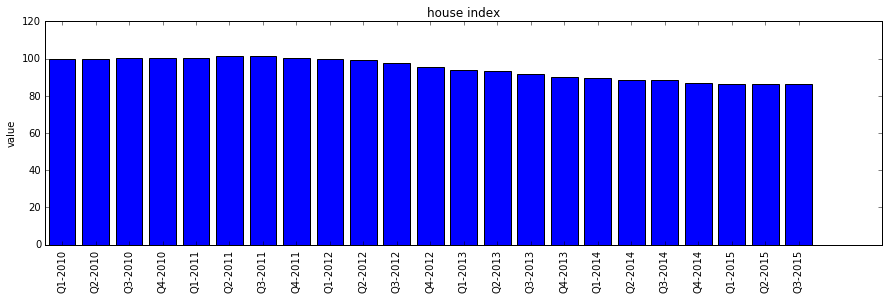
%matplotlib inline
import matplotlib.pyplot as plt

values = filtered['Value'].tolist()
labels = filtered['Time and frequency']

xs = [i + 0.1 for i, _ in enumerate(values)]
# bars are by default width 0.8, so we'll add 0.1 to the left coordinates
# so that each bar is centered

# plot bars with left x-coordinates [xs], heights [num_oscars]
plt.figure(figsize=(15,4))
plt.bar(xs, values)
plt.ylabel("value")
plt.title("house index")

# label x-axis with movie names at bar centers
plt.xticks([i + 0.5 for i, _ in enumerate(labels)], labels, rotation='vertical')
plt.show()